- +1-315-215-1633
- sales@thebrainyinsights.com

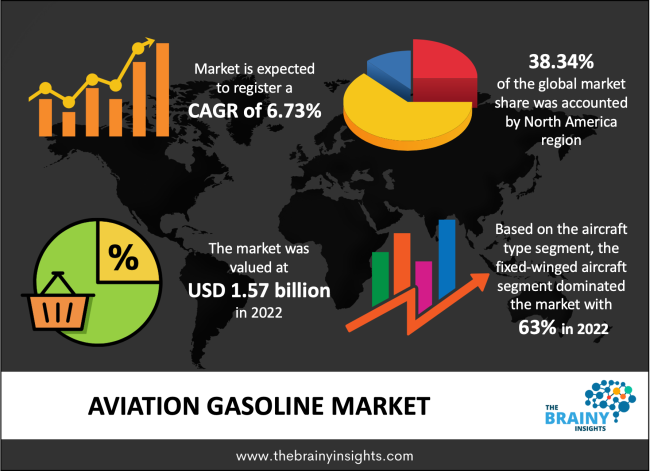
The global aviation gasoline market is expected to reach USD 2.64 billion by 2030, at a CAGR of 6.73% from 2022 to 2030. Aviation gasoline market growth would be driven by the rising demand for aircraft for commercial flight operations, transport of cargo, recreational sports, charter flights, tourism, and medical activities.
A machine that is capable of flight is known as any aircraft. Some aircraft types are hot air balloons, helicopters, airplanes, powered parachutes, and jets. The aviation industry uses various types of fuels for operation. The most common fuel used by piston-turbine engine-powered aircraft is aviation gasoline or avgas. They are used in aircraft with an internal combustion engine that utilizes spark ignition to start the machine. Avgas or aviation gasoline have lower freezing points, ideal for high-altitude flying. They are capable of lifting heavy aircraft carriers over long distances and heights. Avgas 100, avgas 10LL, avgas 80, avgas 115, and avgas UL91/94 are some aviation gasoline fuels used in the aviation industry. The chemical composition of aviation gasoline has gasoline, tetraethyl lead, toluene, and a mixed isomer of xylene. Product innovations have led to the development of avgas with lower lead concentration, like avgas 100LL, which is increasingly being adopted in the aviation sector. Avgas is more refined, cleaner, and burns smoother than other fuels.
Get an overview of this study by requesting a free sample
A Memorandum of Understanding (MoU) for supplying more than 800,000 tonnes of Sustainable Aviation Fuel for the years 2023 to 2030 has been signed by OMV, an international integrated oil, gas, and chemicals corporation, and the Lufthansa Group. The businesses want to broaden their current alliance to incorporate new SAF production and delivery sites and SAF production technology. Since March 2022, OMV has provided Austrian Airlines, a member of the Lufthansa Group, with the initial quantities of SAF at Vienna International Airport.
September 2022 - By introducing a new low-emission SAF, Delta and DG Fuels, LLC significantly contributes to expanding the fuel options for sustainable aviation. According to a new contract, the low-emissions fuel provider intends to create a new SAF supply stream that may give Delta 385 million gallons of unblended sustainable aviation fuel while also assisting in expanding SAF's availability in underserved markets.
1. Introduction
1.1. Objectives of the Study
1.2. Market Definition
1.3. Research Scope
1.4. Currency
1.5. Key Target Audience
2. Research Methodology and Assumptions
3. Executive Summary
4. Premium Insights
4.1. Porter’s Five Forces Analysis
4.2. Value Chain Analysis
4.3. Top Investment Pockets
4.3.1. Market Attractiveness Analysis by Aircraft Type
4.3.2. Market Attractiveness Analysis by Fuel Type
4.3.3. Market Attractiveness Analysis by End User
4.3.4. Market Attractiveness Analysis by Region
4.4. Industry Trends
5. Market Dynamics
5.1. Market Evaluation
5.2. Drivers
5.2.1. The increasing demand for business aviation
5.3. Restraints
5.3.1. The emergence of hybrid and electric aviation carriers
5.4. Opportunities
5.4.1. Technological advancements and product innovations
5.5. Challenges
5.5.1. A difficult recovery after the pandemic
6. Global Aviation Gasoline Market Analysis and Forecast, By Aircraft Type
6.1. Segment Overview
6.2. Fixed-wing
6.3. Rotorcraft
6.4. Others
7. Global Aviation Gasoline Market Analysis and Forecast, By Fuel Type
7.1. Segment Overview
7.2. Avgas 100
7.3. Avgas 100LL
7.4. Avgas 80
7.5. Avgas 115
7.6. Avgas UL91
7.7. Avgas UL94
7.8. Others
8. Global Aviation Gasoline Market Analysis and Forecast, By End User
8.1. Segment Overview
8.2. Private
8.3. Commercial
8.4. Military
9. Global Aviation Gasoline Market Analysis and Forecast, By Regional Analysis
9.1. Segment Overview
9.2. North America
9.2.1. U.S.
9.2.2. Canada
9.2.3. Mexico
9.3. Europe
9.3.1. Germany
9.3.2. France
9.3.3. U.K.
9.3.4. Italy
9.3.5. Spain
9.4. Asia-Pacific
9.4.1. Japan
9.4.2. China
9.4.3. India
9.5. South America
9.5.1. Brazil
9.6. Middle East and Africa
9.6.1. UAE
9.6.2. South Africa
10. Global Aviation Gasoline Market-Competitive Landscape
10.1. Overview
10.2. Market Share of Key Players in the Aviation Gasoline Market
10.2.1. Global Company Market Share
10.2.2. North America Company Market Share
10.2.3. Europe Company Market Share
10.2.4. APAC Company Market Share
10.3. Competitive Situations and Trends
10.3.1. Product Launches and Developments
10.3.2. Partnerships, Collaborations, and Agreements
10.3.3. Mergers & Acquisitions
10.3.4. Expansions
11. Company Profiles
11.1. BP Plc
11.1.1. Business Overview
11.1.2. Company Snapshot
11.1.3. Company Market Share Analysis
11.1.4. Company Product Portfolio
11.1.5. Recent Developments
11.1.6. SWOT Analysis
11.2. ExxonMobil
11.2.1. Business Overview
11.2.2. Company Snapshot
11.2.3. Company Market Share Analysis
11.2.4. Company Product Portfolio
11.2.5. Recent Developments
11.2.6. SWOT Analysis
11.3. Hjelmco Oil AB
11.3.1. Business Overview
11.3.2. Company Snapshot
11.3.3. Company Market Share Analysis
11.3.4. Company Product Portfolio
11.3.5. Recent Developments
11.3.6. SWOT Analysis
11.4. Indian Oil Corporation Limited
11.4.1. Business Overview
11.4.2. Company Snapshot
11.4.3. Company Market Share Analysis
11.4.4. Company Product Portfolio
11.4.5. Recent Developments
11.4.6. SWOT Analysis
11.5. Naftal
11.5.1. Business Overview
11.5.2. Company Snapshot
11.5.3. Company Market Share Analysis
11.5.4. Company Product Portfolio
11.5.5. Recent Developments
11.5.6. SWOT Analysis
11.6. Philips 66
11.6.1. Business Overview
11.6.2. Company Snapshot
11.6.3. Company Market Share Analysis
11.6.4. Company Product Portfolio
11.6.5. Recent Developments
11.6.6. SWOT Analysis
11.7. Repsol
11.7.1. Business Overview
11.7.2. Company Snapshot
11.7.3. Company Market Share Analysis
11.7.4. Company Product Portfolio
11.7.5. Recent Developments
11.7.6. SWOT Analysis
11.8. Shell
11.8.1. Business Overview
11.8.2. Company Snapshot
11.8.3. Company Market Share Analysis
11.8.4. Company Product Portfolio
11.8.5. Recent Developments
11.8.6. SWOT Analysis
11.9. Total
11.9.1. Business Overview
11.9.2. Company Snapshot
11.9.3. Company Market Share Analysis
11.9.4. Company Product Portfolio
11.9.5. Recent Developments
11.9.6. SWOT Analysis
11.10. Vitol Group
11.10.1. Business Overview
11.10.2. Company Snapshot
11.10.3. Company Market Share Analysis
11.10.4. Company Product Portfolio
11.10.5. Recent Developments
11.10.6. SWOT Analysis
List of Table
1. Global Aviation Gasoline Market, By Aircraft Type, 2019-2030 (USD Billion)
2. Global Fixed-Wing Aviation Gasoline Market, By Region, 2019-2030 (USD Billion)
3. Global Rotorcraft Aviation Gasoline Market, By Region, 2019-2030 (USD Billion)
4. Global Others Aviation Gasoline Market, By Region, 2019-2030 (USD Billion)
5. Global Aviation Gasoline Market, By Fuel Type, 2019-2030 (USD Billion)
6. Global Avgas 100 Aviation Gasoline Market, By Region, 2019-2030 (USD Billion)
7. Global Avgas 100LL Aviation Gasoline Market, By Region, 2019-2030 (USD Billion)
8. Global Avgas 80 Aviation Gasoline Market, By Region, 2019-2030 (USD Billion)
9. Global Avgas 115 Aviation Gasoline Market, By Region, 2019-2030 (USD Billion)
10. Global Avgas UL91 Aviation Gasoline Market, By Region, 2019-2030 (USD Billion)
11. Global Avgas UL94 Aviation Gasoline Market, By Region, 2019-2030 (USD Billion)
12. Global Others Aviation Gasoline Market, By Region, 2019-2030 (USD Billion)
13. Global Aviation Gasoline Market, By End User, 2019-2030 (USD Billion)
14. Global Private Aviation Gasoline Market, By Region, 2019-2030 (USD Billion)
15. Global Commercial Aviation Gasoline Market, By Region, 2019-2030 (USD Billion)
16. Global Military Aviation Gasoline Market, By Region, 2019-2030 (USD Billion)
17. Global Aviation Gasoline Market, By Region, 2019-2030 (USD Billion)
18. North America Aviation Gasoline Market, By Aircraft Type, 2019-2030 (USD Billion)
19. North America Aviation Gasoline Market, By Fuel Type, 2019-2030 (USD Billion)
20. North America Aviation Gasoline Market, By End User, 2019-2030 (USD Billion)
21. U.S. Aviation Gasoline Market, By Aircraft Type, 2019-2030 (USD Billion)
22. U.S. Aviation Gasoline Market, By Fuel Type, 2019-2030 (USD Billion)
23. U.S. Aviation Gasoline Market, By End User, 2019-2030 (USD Billion)
24. Canada Aviation Gasoline Market, By Aircraft Type, 2019-2030 (USD Billion)
25. Canada Aviation Gasoline Market, By Fuel Type, 2019-2030 (USD Billion)
26. Canada Aviation Gasoline Market, By End User, 2019-2030 (USD Billion)
27. Mexico Aviation Gasoline Market, By Aircraft Type, 2019-2030 (USD Billion)
28. Mexico Aviation Gasoline Market, By Fuel Type, 2019-2030 (USD Billion)
29. Mexico Aviation Gasoline Market, By End User, 2019-2030 (USD Billion)
30. Europe Aviation Gasoline Market, By Aircraft Type, 2019-2030 (USD Billion)
31. Europe Aviation Gasoline Market, By Fuel Type, 2019-2030 (USD Billion)
32. Europe Aviation Gasoline Market, By End User, 2019-2030 (USD Billion)
33. Germany Aviation Gasoline Market, By Aircraft Type, 2019-2030 (USD Billion)
34. Germany Aviation Gasoline Market, By Fuel Type, 2019-2030 (USD Billion)
35. Germany Aviation Gasoline Market, By End User, 2019-2030 (USD Billion)
36. France Aviation Gasoline Market, By Aircraft Type, 2019-2030 (USD Billion)
37. France Aviation Gasoline Market, By Fuel Type, 2019-2030 (USD Billion)
38. France Aviation Gasoline Market, By End User, 2019-2030 (USD Billion)
39. U.K. Aviation Gasoline Market, By Aircraft Type, 2019-2030 (USD Billion)
40. U.K. Aviation Gasoline Market, By Fuel Type, 2019-2030 (USD Billion)
41. U.K. Aviation Gasoline Market, By End User, 2019-2030 (USD Billion)
42. Italy Aviation Gasoline Market, By Aircraft Type, 2019-2030 (USD Billion)
43. Italy Aviation Gasoline Market, By Fuel Type, 2019-2030 (USD Billion)
44. Italy Aviation Gasoline Market, By End User, 2019-2030 (USD Billion)
45. Spain Aviation Gasoline Market, By Aircraft Type, 2019-2030 (USD Billion)
46. Spain Aviation Gasoline Market, By Fuel Type, 2019-2030 (USD Billion)
47. Spain Aviation Gasoline Market, By End User, 2019-2030 (USD Billion)
48. Asia Pacific Aviation Gasoline Market, By Aircraft Type, 2019-2030 (USD Billion)
49. Asia Pacific Aviation Gasoline Market, By Fuel Type, 2019-2030 (USD Billion)
50. Asia Pacific Aviation Gasoline Market, By End User, 2019-2030 (USD Billion)
51. Japan Aviation Gasoline Market, By Aircraft Type, 2019-2030 (USD Billion)
52. Japan Aviation Gasoline Market, By Fuel Type, 2019-2030 (USD Billion)
53. Japan Aviation Gasoline Market, By End User, 2019-2030 (USD Billion)
54. China Aviation Gasoline Market, By Aircraft Type, 2019-2030 (USD Billion)
55. China Aviation Gasoline Market, By Fuel Type, 2019-2030 (USD Billion)
56. China Aviation Gasoline Market, By End User, 2019-2030 (USD Billion)
57. India Aviation Gasoline Market, By Aircraft Type, 2019-2030 (USD Billion)
58. India Aviation Gasoline Market, By Fuel Type, 2019-2030 (USD Billion)
59. India Aviation Gasoline Market, By End User, 2019-2030 (USD Billion)
60. South America Aviation Gasoline Market, By Aircraft Type, 2019-2030 (USD Billion)
61. South America Aviation Gasoline Market, By Fuel Type, 2019-2030 (USD Billion)
62. South America Aviation Gasoline Market, By End User, 2019-2030 (USD Billion)
63. Brazil Aviation Gasoline Market, By Aircraft Type, 2019-2030 (USD Billion)
64. Brazil Aviation Gasoline Market, By Fuel Type, 2019-2030 (USD Billion)
65. Brazil Aviation Gasoline Market, By End User, 2019-2030 (USD Billion)
66. Middle East and Africa Aviation Gasoline Market, By Aircraft Type, 2019-2030 (USD Billion)
67. Middle East and Africa Aviation Gasoline Market, By Fuel Type, 2019-2030 (USD Billion)
68. Middle East and Africa Aviation Gasoline Market, By End User, 2019-2030 (USD Billion)
69. UAE Aviation Gasoline Market, By Aircraft Type, 2019-2030 (USD Billion)
70. UAE Aviation Gasoline Market, By Fuel Type, 2019-2030 (USD Billion)
71. UAE Aviation Gasoline Market, By End User, 2019-2030 (USD Billion)
72. South Africa Aviation Gasoline Market, By Aircraft Type, 2019-2030 (USD Billion)
73. South Africa Aviation Gasoline Market, By Fuel Type, 2019-2030 (USD Billion)
74. South Africa Aviation Gasoline Market, By End User, 2019-2030 (USD Billion)
List of Figures
1. Global Aviation Gasoline Market Segmentation
2. Aviation Gasoline Market: Research Methodology
3. Market Size Estimation Methodology: Bottom-Up Approach
4. Market Size Estimation Methodology: Top-Down Approach
5. Data Triangulation
6. Porter’s Five Forces Analysis
7. Value Chain Analysis
8. Global Aviation Gasoline Market Attractiveness Analysis by Aircraft Type
9. Global Aviation Gasoline Market Attractiveness Analysis by Fuel Type
10. Global Aviation Gasoline Market Attractiveness Analysis by End User
11. Global Aviation Gasoline Market Attractiveness Analysis by Region
12. Global Aviation Gasoline Market: Dynamics
13. Global Aviation Gasoline Market Share by Aircraft Type (2022 & 2030)
14. Global Aviation Gasoline Market Share by Fuel Type (2022 & 2030)
15. Global Aviation Gasoline Market Share by End User (2022 & 2030)
16. Global Aviation Gasoline Market Share by Regions (2022 & 2030)
17. Global Aviation Gasoline Market Share by Company (2021)
This study forecasts revenue at global, regional, and country levels from 2019 to 2030. The Brainy Insights has segmented the global aviation gasoline market based on below-mentioned segments:
Global Aviation Gasoline Market by Aircraft Type:
Global Aviation Gasoline Market by Fuel Type:
Global Aviation Gasoline Market by End User:
Global Aviation Gasoline Market by Region:
Research has its special purpose to undertake marketing efficiently. In this competitive scenario, businesses need information across all industry verticals; the information about customer wants, market demand, competition, industry trends, distribution channels etc. This information needs to be updated regularly because businesses operate in a dynamic environment. Our organization, The Brainy Insights incorporates scientific and systematic research procedures in order to get proper market insights and industry analysis for overall business success. The analysis consists of studying the market from a miniscule level wherein we implement statistical tools which helps us in examining the data with accuracy and precision.
Our research reports feature both; quantitative and qualitative aspects for any market. Qualitative information for any market research process are fundamental because they reveal the customer needs and wants, usage and consumption for any product/service related to a specific industry. This in turn aids the marketers/investors in knowing certain perceptions of the customers. Qualitative research can enlighten about the different product concepts and designs along with unique service offering that in turn, helps define marketing problems and generate opportunities. On the other hand, quantitative research engages with the data collection process through interviews, e-mail interactions, surveys and pilot studies. Quantitative aspects for the market research are useful to validate the hypotheses generated during qualitative research method, explore empirical patterns in the data with the help of statistical tools, and finally make the market estimations.
The Brainy Insights offers comprehensive research and analysis, based on a wide assortment of factual insights gained through interviews with CXOs and global experts and secondary data from reliable sources. Our analysts and industry specialist assume vital roles in building up statistical tools and analysis models, which are used to analyse the data and arrive at accurate insights with exceedingly informative research discoveries. The data provided by our organization have proven precious to a diverse range of companies, facilitating them to address issues such as determining which products/services are the most appealing, whether or not customers use the product in the manner anticipated, the purchasing intentions of the market and many others.
Our research methodology encompasses an idyllic combination of primary and secondary initiatives. Key phases involved in this process are listed below:

The phase involves the gathering and collecting of market data and its related information with the help of different sources & research procedures.

The data procurement stage involves in data gathering and collecting through various data sources.
This stage involves in extensive research. These data sources includes:
Purchased Database: Purchased databases play a crucial role in estimating the market sizes irrespective of the domain. Our purchased database includes:
Primary Research: The Brainy Insights interacts with leading companies and experts of the concerned domain to develop the analyst team’s market understanding and expertise. It improves and substantiates every single data presented in the market reports. Primary research mainly involves in telephonic interviews, E-mail interactions and face-to-face interviews with the raw material providers, manufacturers/producers, distributors, & independent consultants. The interviews that we conduct provides valuable data on market size and industry growth trends prevailing in the market. Our organization also conducts surveys with the various industry experts in order to gain overall insights of the industry/market. For instance, in healthcare industry we conduct surveys with the pharmacists, doctors, surgeons and nurses in order to gain insights and key information of a medical product/device/equipment which the customers are going to usage. Surveys are conducted in the form of questionnaire designed by our own analyst team. Surveys plays an important role in primary research because surveys helps us to identify the key target audiences of the market. Additionally, surveys helps to identify the key target audience engaged with the market. Our survey team conducts the survey by targeting the key audience, thus gaining insights from them. Based on the perspectives of the customers, this information is utilized to formulate market strategies. Moreover, market surveys helps us to understand the current competitive situation of the industry. To be precise, our survey process typically involve with the 360 analysis of the market. This analytical process begins by identifying the prospective customers for a product or service related to the market/industry to obtain data on how a product/service could fit into customers’ lives.

Secondary Research: The secondary data sources includes information published by the on-profit organizations such as World bank, WHO, company fillings, investor presentations, annual reports, national government documents, statistical databases, blogs, articles, white papers and others. From the annual report, we analyse a company’s revenue to understand the key segment and market share of that organization in a particular region. We analyse the company websites and adopt the product mapping technique which is important for deriving the segment revenue. In the product mapping method, we select and categorize the products offered by the companies catering to domain specific market, deduce the product revenue for each of the companies so as to get overall estimation of the market size. We also source data and analyses trends based on information received from supply side and demand side intermediaries in the value chain. The supply side denotes the data gathered from supplier, distributor, wholesaler and the demand side illustrates the data gathered from the end customers for respective market domain.

The supply side for a domain specific market is analysed by:
The demand side for the market is estimated through:
In-house Library: Apart from these third-party sources, we have our in-house library of qualitative and quantitative information. Our in-house database includes market data for various industry and domains. These data are updated on regular basis as per the changing market scenario. Our library includes, historic databases, internal audit reports and archives.
Sometimes there are instances where there is no metadata or raw data available for any domain specific market. For those cases, we use our expertise to forecast and estimate the market size in order to generate comprehensive data sets. Our analyst team adopt a robust research technique in order to produce the estimates:
Data Synthesis: This stage involves the analysis & mapping of all the information obtained from the previous step. It also involves in scrutinizing the data for any discrepancy observed while data gathering related to the market. The data is collected with consideration to the heterogeneity of sources. Robust scientific techniques are in place for synthesizing disparate data sets and provide the essential contextual information that can orient market strategies. The Brainy Insights has extensive experience in data synthesis where the data passes through various stages:


Market Deduction & Formulation: The final stage comprises of assigning data points at appropriate market spaces so as to deduce feasible conclusions. Analyst perspective & subject matter expert based holistic form of market sizing coupled with industry analysis also plays a crucial role in this stage.
This stage involves in finalization of the market size and numbers that we have collected from data integration step. With data interpolation, it is made sure that there is no gap in the market data. Successful trend analysis is done by our analysts using extrapolation techniques, which provide the best possible forecasts for the market.
Data Validation & Market Feedback: Validation is the most important step in the process. Validation & re-validation via an intricately designed process helps us finalize data-points to be used for final calculations.

The Brainy Insights interacts with leading companies and experts of the concerned domain to develop the analyst team’s market understanding and expertise. It improves and substantiates every single data presented in the market reports. The data validation interview and discussion panels are typically composed of the most experienced industry members. The participants include, however, are not limited to:
Moreover, we always validate our data and findings through primary respondents from all the major regions we are working on.
Free Customization
Fortune 500 Clients
Free Yearly Update On Purchase Of Multi/Corporate License
Companies Served Till Date