- +1-315-215-1633
- sales@thebrainyinsights.com

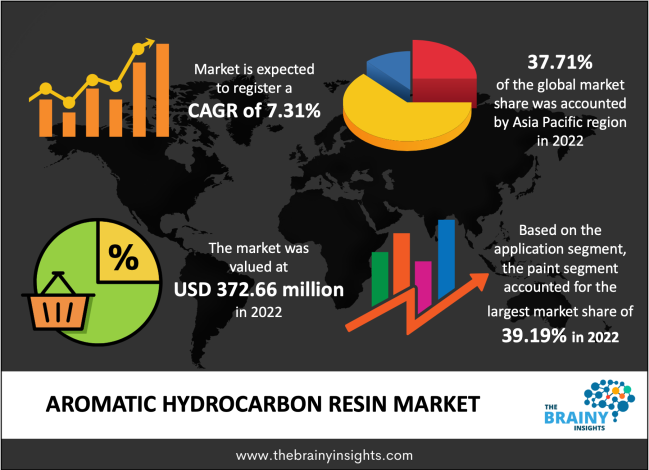
The global aromatic hydrocarbon resin market was valued at USD 372.66 million in 2022, increasing at a CAGR of 7.31% from 2022 to 2030 and is anticipated to reach USD 655.19 million by 2030. Asia-Pacific is expected to grow the fastest during the forecast period. The aromatic hydrocarbon resin industry was negatively affected by the COVID-19 epidemic. The hydrocarbon resin market also suffered due to the decrease in demand from end-user industries, as there was a significant decrease in manufacturing. The organizations related to hydrocarbon resins witnessed the disruption in the supply chain of many end-user markets.
C9 petroleum resin is manufactured using the process of thermal polymerization, fractionation, flash evaporation, and molding with C9 as the raw material from ethylene fragmentation. It has fine gloss, transparency, insulation, compatibility, excellent solubility, stability towards acid-based chemicals, good bonding, and good thermal conductivity. In comparison to C5 resins, C9 has higher melt viscosity. It has a darker color and a higher softening point varying from 100 to 150 °C. Also, C9 resins are very adaptable and are compatible with many polymers. C9 hydrocarbon resin is made using C9 fraction derivatives of petroleum cracking via polymerization, pretreatment, and distillation. This is a low polymer having a molecular weight between 300 to 3000. Aromatic hydrocarbon resin has broad applications. For instance, paints generally utilise C9 hydrocarbon resin having high softening points. The addition of C9 hydrocarbon resin can increase the final finishing of paints and paint films' adhesiveness & hardness. It increases the resistance to alkaline and acid elements. Rubbers also utilise C9 hydrocarbon resin having low softening points. These resins have excellent mutual solubilities with natural rubber particles, and there is no impact of sulphurization of rubber. These resins have good adhesiveness and hence improve the adhesiveness of adhesives and resistance to alkaline, acid and water. Consequently, this helps reduce production costs. Moreover, C9 hydrocarbon resin with a high softening point is utilised for printing inks as it helps increase printing properties like color spreading and the fast dry and brightening effects that the resins offer. Also, C9 hydrocarbon resin has specific unsaturation properties, which are utilised as plastic modifiers, paper-glutting agents etc.
Get an overview of this study by requesting a free sample
For example, in December 2016, Rufayah Chemicals Company (RCC), a Saudi Arabia-based downstream organization, signed an agreement with Sadara Chemical to set up the biggest hydrocarbon resin plant. The RCC chemical complex uses the feedstock received from Sadara to produce a broad range of downstream chemical products like isoprene, hydrocarbon resin, aromatic solvents, pure DCPD and premium wash oil, among others.
For example, in April 2022, Synthomer plc acquired the adhesive resins business of Eastman Chemical Company, including pure monomer resins, hydrocarbon resins, polyolefin polymers, fatty-acid-based resins and others product lines. This has led Synthomer to form new Adhesive Technologies Division which produces and markets tackifying resins and additives for adhesive products having a robust focus on the end-user market like packaging, hygiene and high-performance tire additives.
1. Introduction
1.1. Objectives of the Study
1.2. Market Definition
1.3. Research Scope
1.4. Currency
1.5. Key Target Audience
2. Research Methodology and Assumptions
3. Executive Summary
4. Premium Insights
4.1. Porter’s Five Forces Analysis
4.2. Value Chain Analysis
4.3. Top Investment Pockets
4.3.1. Market Attractiveness Analysis by Type
4.3.2. Market Attractiveness Analysis by Application
4.3.3. Market Attractiveness Analysis by Region
4.4. Industry Trends
5. Market Dynamics
5.1. Market Evaluation
5.2. Drivers
5.2.1. Growing paint and coating sector
5.2.2. Growing use in the automotive sector
5.3. Restraints
5.3.1. Fluctuations in the price of raw materials
5.4. Opportunities
5.4.1. Rapid urbanization
5.5. Challenges
5.5.1. Economic slowdown
6. Global Aromatic Hydrocarbon Resin Market Analysis and Forecast, By Type
6.1. Segment Overview
6.2. Thermal Polymerization Method
6.3. Catalytic Polymerization Method
7. Global Aromatic Hydrocarbon Resin Market Analysis and Forecast, By Application
7.1. Segment Overview
7.2. Paint
7.3. Rubber
7.4. Adhesive & Sealant
7.5. Printing Ink
7.6. Others
8. Global Aromatic Hydrocarbon Resin Market Analysis and Forecast, By Regional Analysis
8.1. Segment Overview
8.2. North America
8.2.1. U.S.
8.2.2. Canada
8.2.3. Mexico
8.3. Europe
8.3.1. Germany
8.3.2. France
8.3.3. U.K.
8.3.4. Italy
8.3.5. Spain
8.4. Asia-Pacific
8.4.1. Japan
8.4.2. China
8.4.3. India
8.5. South America
8.5.1. Brazil
8.6. Middle East and Africa
8.6.1. UAE
8.6.2. South Africa
9. Global Aromatic Hydrocarbon Resin Market-Competitive Landscape
9.1. Overview
9.2. Market Share of Key Players in the Aromatic Hydrocarbon Resin Market
9.2.1. Global Company Market Share
9.2.2. North America Company Market Share
9.2.3. Europe Company Market Share
9.2.4. APAC Company Market Share
9.3. Competitive Situations and Trends
9.3.1. Product Launches and Developments
9.3.2. Partnerships, Collaborations, and Agreements
9.3.3. Mergers & Acquisitions
9.3.4. Expansions
10. Company Profiles
10.1. Resinall Corp. (Subsidiary of Ergon Chemicals, LLC)
10.1.1. Business Overview
10.1.2. Company Snapshot
10.1.3. Company Market Share Analysis
10.1.4. Company Product Portfolio
10.1.5. Recent Developments
10.1.6. SWOT Analysis
10.2. Shandong Qilong Chemical Co., Ltd.
10.2.1. Business Overview
10.2.2. Company Snapshot
10.2.3. Company Market Share Analysis
10.2.4. Company Product Portfolio
10.2.5. Recent Developments
10.2.6. SWOT Analysis
10.3. Puyang Changyu Petroleum Resins Co., Ltd.
10.3.1. Business Overview
10.3.2. Company Snapshot
10.3.3. Company Market Share Analysis
10.3.4. Company Product Portfolio
10.3.5. Recent Developments
10.3.6. SWOT Analysis
10.4. Henan G&D Chemical Products Co., Ltd.
10.4.1. Business Overview
10.4.2. Company Snapshot
10.4.3. Company Market Share Analysis
10.4.4. Company Product Portfolio
10.4.5. Recent Developments
10.4.6. SWOT Analysis
10.5. Neville Chemical Company
10.5.1. Business Overview
10.5.2. Company Snapshot
10.5.3. Company Market Share Analysis
10.5.4. Company Product Portfolio
10.5.5. Recent Developments
10.5.6. SWOT Analysis
10.6. Mitsui Chemicals, Inc.
10.6.1. Business Overview
10.6.2. Company Snapshot
10.6.3. Company Market Share Analysis
10.6.4. Company Product Portfolio
10.6.5. Recent Developments
10.6.6. SWOT Analysis
10.7. United Performance Materials Corporation (UPM)
10.7.1. Business Overview
10.7.2. Company Snapshot
10.7.3. Company Market Share Analysis
10.7.4. Company Product Portfolio
10.7.5. Recent Developments
10.7.6. SWOT Analysis
10.8. Puyang Shenghong Chemical Co., Ltd.
10.8.1. Business Overview
10.8.2. Company Snapshot
10.8.3. Company Market Share Analysis
10.8.4. Company Product Portfolio
10.8.5. Recent Developments
10.8.6. SWOT Analysis
10.9. Henghe Materials & Science Technology Co., Ltd.
10.9.1. Business Overview
10.9.2. Company Snapshot
10.9.3. Company Market Share Analysis
10.9.4. Company Product Portfolio
10.9.5. Recent Developments
10.9.6. SWOT Analysis
10.10. Rain Carbon Inc. (Subsidiary of Rain Carbon Inc.)
10.10.1. Business Overview
10.10.2. Company Snapshot
10.10.3. Company Market Share Analysis
10.10.4. Company Product Portfolio
10.10.5. Recent Developments
10.10.6. SWOT Analysis
10.11. Daqing Huake Co., Ltd.
10.11.1. Business Overview
10.11.2. Company Snapshot
10.11.3. Company Market Share Analysis
10.11.4. Company Product Portfolio
10.11.5. Recent Developments
10.11.6. SWOT Analysis
List of Table
1. Global Aromatic Hydrocarbon Resin Market, By Type, 2019-2030 (USD Billion)
2. Global Thermal Polymerization Method Aromatic Hydrocarbon Resin Market, By Region, 2019-2030 (USD Billion)
3. Global Catalytic Polymerization Method Aromatic Hydrocarbon Resin Market, By Region, 2019-2030 (USD Billion)
4. Global Aromatic Hydrocarbon Resin Market, By Application, 2019-2030 (USD Billion)
5. Global Paint Aromatic Hydrocarbon Resin Market, By Region, 2019-2030 (USD Billion)
6. Global Rubber Aromatic Hydrocarbon Resin Market, By Region, 2019-2030 (USD Billion)
7. Global Adhesive & Sealant Aromatic Hydrocarbon Resin Market, By Region, 2019-2030 (USD Billion)
8. Global Printing Ink Aromatic Hydrocarbon Resin Market, By Region, 2019-2030 (USD Billion)
9. Global Others Aromatic Hydrocarbon Resin Market, By Region, 2019-2030 (USD Billion)
10. Global Aromatic Hydrocarbon Resin Market, By Region, 2019-2030 (USD Billion)
11. North America Aromatic Hydrocarbon Resin Market, By Type, 2019-2030 (USD Billion)
12. North America Aromatic Hydrocarbon Resin Market, By Application, 2019-2030 (USD Billion)
13. U.S. Aromatic Hydrocarbon Resin Market, By Type, 2019-2030 (USD Billion)
14. U.S. Aromatic Hydrocarbon Resin Market, By Application, 2019-2030 (USD Billion)
15. Canada Aromatic Hydrocarbon Resin Market, By Type, 2019-2030 (USD Billion)
16. Canada Aromatic Hydrocarbon Resin Market, By Application, 2019-2030 (USD Billion)
17. Mexico Aromatic Hydrocarbon Resin Market, By Type, 2019-2030 (USD Billion)
18. Mexico Aromatic Hydrocarbon Resin Market, By Application, 2019-2030 (USD Billion)
19. Europe Aromatic Hydrocarbon Resin Market, By Type, 2019-2030 (USD Billion)
20. Europe Aromatic Hydrocarbon Resin Market, By Application, 2019-2030 (USD Billion)
21. Germany Aromatic Hydrocarbon Resin Market, By Type, 2019-2030 (USD Billion)
22. Germany Aromatic Hydrocarbon Resin Market, By Application, 2019-2030 (USD Billion)
23. France Aromatic Hydrocarbon Resin Market, By Type, 2019-2030 (USD Billion)
24. France Aromatic Hydrocarbon Resin Market, By Application, 2019-2030 (USD Billion)
25. U.K. Aromatic Hydrocarbon Resin Market, By Type, 2019-2030 (USD Billion)
26. U.K. Aromatic Hydrocarbon Resin Market, By Application, 2019-2030 (USD Billion)
27. Italy Aromatic Hydrocarbon Resin Market, By Type, 2019-2030 (USD Billion)
28. Italy Aromatic Hydrocarbon Resin Market, By Application, 2019-2030 (USD Billion)
29. Spain Aromatic Hydrocarbon Resin Market, By Type, 2019-2030 (USD Billion)
30. Spain Aromatic Hydrocarbon Resin Market, By Application, 2019-2030 (USD Billion)
31. Asia Pacific Aromatic Hydrocarbon Resin Market, By Type, 2019-2030 (USD Billion)
32. Asia Pacific Aromatic Hydrocarbon Resin Market, By Application, 2019-2030 (USD Billion)
33. Japan Aromatic Hydrocarbon Resin Market, By Type, 2019-2030 (USD Billion)
34. Japan Aromatic Hydrocarbon Resin Market, By Application, 2019-2030 (USD Billion)
35. China Aromatic Hydrocarbon Resin Market, By Type, 2019-2030 (USD Billion)
36. China Aromatic Hydrocarbon Resin Market, By Application, 2019-2030 (USD Billion)
37. India Aromatic Hydrocarbon Resin Market, By Type, 2019-2030 (USD Billion)
38. India Aromatic Hydrocarbon Resin Market, By Application, 2019-2030 (USD Billion)
39. South America Aromatic Hydrocarbon Resin Market, By Type, 2019-2030 (USD Billion)
40. South America Aromatic Hydrocarbon Resin Market, By Application, 2019-2030 (USD Billion)
41. Brazil Aromatic Hydrocarbon Resin Market, By Type, 2019-2030 (USD Billion)
42. Brazil Aromatic Hydrocarbon Resin Market, By Application, 2019-2030 (USD Billion)
43. Middle East and Africa Aromatic Hydrocarbon Resin Market, By Type, 2019-2030 (USD Billion)
44. Middle East and Africa Aromatic Hydrocarbon Resin Market, By Application, 2019-2030 (USD Billion)
45. UAE Aromatic Hydrocarbon Resin Market, By Type, 2019-2030 (USD Billion)
46. UAE Aromatic Hydrocarbon Resin Market, By Application, 2019-2030 (USD Billion)
47. South Africa Aromatic Hydrocarbon Resin Market, By Type, 2019-2030 (USD Billion)
48. South Africa Aromatic Hydrocarbon Resin Market, By Application, 2019-2030 (USD Billion)
List of Figures
1. Global Aromatic Hydrocarbon Resin Market Segmentation
2. Aromatic Hydrocarbon Resin Market: Research Methodology
3. Market Size Estimation Methodology: Bottom-Up Approach
4. Market Size Estimation Methodology: Top-Down Approach
5. Data Triangulation
6. Porter’s Five Forces Analysis
7. Value Chain Analysis
8. Global Aromatic Hydrocarbon Resin Market Attractiveness Analysis by Type
9. Global Aromatic Hydrocarbon Resin Market Attractiveness Analysis by Application
10. Global Aromatic Hydrocarbon Resin Market Attractiveness Analysis by Region
11. Global Aromatic Hydrocarbon Resin Market: Dynamics
12. Global Aromatic Hydrocarbon Resin Market Share by Type (2022 & 2030)
13. Global Aromatic Hydrocarbon Resin Market Share by Application (2022 & 2030)
14. Global Aromatic Hydrocarbon Resin Market Share by Regions (2022 & 2030)
15. Global Aromatic Hydrocarbon Resin Market Share by Company (2021)
This study forecasts revenue at global, regional, and country levels from 2019 to 2030. The Brainy Insights has segmented the global aromatic hydrocarbon resin market based on below-mentioned segments:
Global Aromatic Hydrocarbon Resin Market by Type:
Global Aromatic Hydrocarbon Resin Market by Application:
Global Aromatic Hydrocarbon Resin Market by Region:
Research has its special purpose to undertake marketing efficiently. In this competitive scenario, businesses need information across all industry verticals; the information about customer wants, market demand, competition, industry trends, distribution channels etc. This information needs to be updated regularly because businesses operate in a dynamic environment. Our organization, The Brainy Insights incorporates scientific and systematic research procedures in order to get proper market insights and industry analysis for overall business success. The analysis consists of studying the market from a miniscule level wherein we implement statistical tools which helps us in examining the data with accuracy and precision.
Our research reports feature both; quantitative and qualitative aspects for any market. Qualitative information for any market research process are fundamental because they reveal the customer needs and wants, usage and consumption for any product/service related to a specific industry. This in turn aids the marketers/investors in knowing certain perceptions of the customers. Qualitative research can enlighten about the different product concepts and designs along with unique service offering that in turn, helps define marketing problems and generate opportunities. On the other hand, quantitative research engages with the data collection process through interviews, e-mail interactions, surveys and pilot studies. Quantitative aspects for the market research are useful to validate the hypotheses generated during qualitative research method, explore empirical patterns in the data with the help of statistical tools, and finally make the market estimations.
The Brainy Insights offers comprehensive research and analysis, based on a wide assortment of factual insights gained through interviews with CXOs and global experts and secondary data from reliable sources. Our analysts and industry specialist assume vital roles in building up statistical tools and analysis models, which are used to analyse the data and arrive at accurate insights with exceedingly informative research discoveries. The data provided by our organization have proven precious to a diverse range of companies, facilitating them to address issues such as determining which products/services are the most appealing, whether or not customers use the product in the manner anticipated, the purchasing intentions of the market and many others.
Our research methodology encompasses an idyllic combination of primary and secondary initiatives. Key phases involved in this process are listed below:

The phase involves the gathering and collecting of market data and its related information with the help of different sources & research procedures.

The data procurement stage involves in data gathering and collecting through various data sources.
This stage involves in extensive research. These data sources includes:
Purchased Database: Purchased databases play a crucial role in estimating the market sizes irrespective of the domain. Our purchased database includes:
Primary Research: The Brainy Insights interacts with leading companies and experts of the concerned domain to develop the analyst team’s market understanding and expertise. It improves and substantiates every single data presented in the market reports. Primary research mainly involves in telephonic interviews, E-mail interactions and face-to-face interviews with the raw material providers, manufacturers/producers, distributors, & independent consultants. The interviews that we conduct provides valuable data on market size and industry growth trends prevailing in the market. Our organization also conducts surveys with the various industry experts in order to gain overall insights of the industry/market. For instance, in healthcare industry we conduct surveys with the pharmacists, doctors, surgeons and nurses in order to gain insights and key information of a medical product/device/equipment which the customers are going to usage. Surveys are conducted in the form of questionnaire designed by our own analyst team. Surveys plays an important role in primary research because surveys helps us to identify the key target audiences of the market. Additionally, surveys helps to identify the key target audience engaged with the market. Our survey team conducts the survey by targeting the key audience, thus gaining insights from them. Based on the perspectives of the customers, this information is utilized to formulate market strategies. Moreover, market surveys helps us to understand the current competitive situation of the industry. To be precise, our survey process typically involve with the 360 analysis of the market. This analytical process begins by identifying the prospective customers for a product or service related to the market/industry to obtain data on how a product/service could fit into customers’ lives.

Secondary Research: The secondary data sources includes information published by the on-profit organizations such as World bank, WHO, company fillings, investor presentations, annual reports, national government documents, statistical databases, blogs, articles, white papers and others. From the annual report, we analyse a company’s revenue to understand the key segment and market share of that organization in a particular region. We analyse the company websites and adopt the product mapping technique which is important for deriving the segment revenue. In the product mapping method, we select and categorize the products offered by the companies catering to domain specific market, deduce the product revenue for each of the companies so as to get overall estimation of the market size. We also source data and analyses trends based on information received from supply side and demand side intermediaries in the value chain. The supply side denotes the data gathered from supplier, distributor, wholesaler and the demand side illustrates the data gathered from the end customers for respective market domain.

The supply side for a domain specific market is analysed by:
The demand side for the market is estimated through:
In-house Library: Apart from these third-party sources, we have our in-house library of qualitative and quantitative information. Our in-house database includes market data for various industry and domains. These data are updated on regular basis as per the changing market scenario. Our library includes, historic databases, internal audit reports and archives.
Sometimes there are instances where there is no metadata or raw data available for any domain specific market. For those cases, we use our expertise to forecast and estimate the market size in order to generate comprehensive data sets. Our analyst team adopt a robust research technique in order to produce the estimates:
Data Synthesis: This stage involves the analysis & mapping of all the information obtained from the previous step. It also involves in scrutinizing the data for any discrepancy observed while data gathering related to the market. The data is collected with consideration to the heterogeneity of sources. Robust scientific techniques are in place for synthesizing disparate data sets and provide the essential contextual information that can orient market strategies. The Brainy Insights has extensive experience in data synthesis where the data passes through various stages:


Market Deduction & Formulation: The final stage comprises of assigning data points at appropriate market spaces so as to deduce feasible conclusions. Analyst perspective & subject matter expert based holistic form of market sizing coupled with industry analysis also plays a crucial role in this stage.
This stage involves in finalization of the market size and numbers that we have collected from data integration step. With data interpolation, it is made sure that there is no gap in the market data. Successful trend analysis is done by our analysts using extrapolation techniques, which provide the best possible forecasts for the market.
Data Validation & Market Feedback: Validation is the most important step in the process. Validation & re-validation via an intricately designed process helps us finalize data-points to be used for final calculations.

The Brainy Insights interacts with leading companies and experts of the concerned domain to develop the analyst team’s market understanding and expertise. It improves and substantiates every single data presented in the market reports. The data validation interview and discussion panels are typically composed of the most experienced industry members. The participants include, however, are not limited to:
Moreover, we always validate our data and findings through primary respondents from all the major regions we are working on.
Free Customization
Fortune 500 Clients
Free Yearly Update On Purchase Of Multi/Corporate License
Companies Served Till Date