- +1-315-215-1633
- sales@thebrainyinsights.com

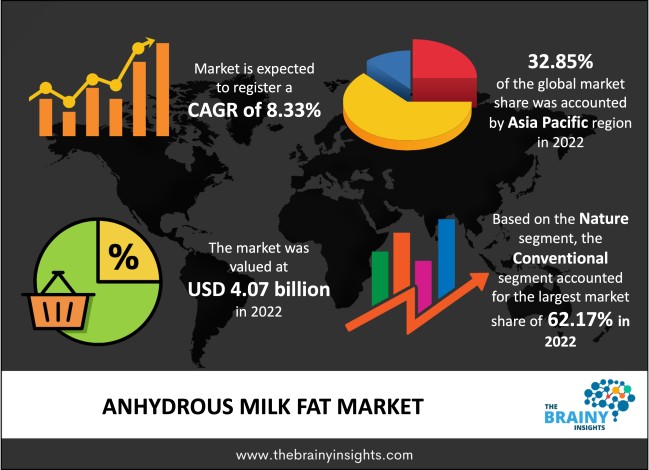
The global anhydrous milk fat market was valued at USD 4.07 billion in 2022 and growing at a CAGR of 8.33% from 2023 to 2032. The market is expected to reach USD 9.05 billion by 2032. North America is expected to increase the fastest during the forecast period.
Triacylglycerols, or glycerol esterified to three fatty acids, are a range of compounds that collectively make up anhydrous milk fat, each with a distinct physical property. Anhydrous milk fat, for instance, melts at a high degree of temperature and has a high melting point. Anhydrous milk fat has an average melting point higher than 40 °C. The anhydrous milk gradually changes into a transparent liquid with a bit of yellow colour due to the inclusion of carotene. When chilled, anhydrous milk fat crystallizes and becomes a soft, slightly coarse, pale white-yellow solid. Butter oil, also known as anhydrous milk fat (AMF), is a dairy product that is high in fat and is made by centrifuging cream or milk to separate the oil fat from it. It is characterized by a whitish-yellow colour and a moderately high-average melting point and is widely accessible in semi-liquid or liquid form. Along with having a lot of calcium and the vitamins A, D, E, and K2, it is also free of fatty acids, chemicals, and preservatives. It gives various cuisine preparations a rich, creamy, dairy flavour. Therefore it gets used in producing a wide variety of bakery goods and culinary practices in commercial and household markets. Anhydrous milk fat is a form of milk fat with no water. It is used to make ice cream, chocolate, and other dairy products and has a high melting point. Another name for anhydrous milk fat is anhydrous butterfat or anhydrous cream. It can be purchased as flakes, powders, or granules. Because lauric, myristic, and palmitic acids are present, it has a white or yellowish-white solid appearance with a fatty odour. Anhydrous milk fat is a concentrated version of butter that is 99.8% milk fat and inherently lactose-free. Additionally, it can be used in bread and confectionery products, dairy products, and dips and spreads. Due to its excellent stability and longer shelf life, anhydrous milk fat will experience rapid market growth due to expanding application use, government spending, and consumer demand. The way that consumers select healthier products is changing. Rather than concentrating only on functional ingredients, they are focusing on more natural products and avoiding those that contain many additives, preservatives, and stabilizers, even if the product advertises it is low in fat. Anhydrous milk fats are becoming increasingly common because they have unaltered flavour, texture, mouthfeel, structure, and anti-bloom qualities. Additionally, customers are prioritizing their health and refusing to compromise on taste, which is driving up demand for items with buttery flavours. Due to its longer shelf life and low moisture content, anhydrous milk fat is frequently stored for several months at room temperature and then quickly shipped throughout the globe. Additionally, it has various applications in the fast food sector, predicted to expand significantly over the coming years. Anhydrous milk fat will become highly in demand worldwide as a result.
Get an overview of this study by requesting a free sample
1. Introduction
1.1. Objective of the Study
1.2. Market Definition
1.3. Research Scope
1.4. Currency
1.5. Key Target Audience
2. Research Methodology and Assumptions
3. Executive Summary
4. Premium Insights
4.1. Porter’s Five Forces Analysis
4.2. Value Chain Analysis
4.3. Top Investment Pockets
4.3.1. Market Attractiveness Analysis By Nature
4.3.2. Market Attractiveness Analysis By Application
4.3.3. Market Attractiveness Analysis By Distribution Channel
4.3.4. Market Attractiveness Analysis By Region
4.4. Industry Trends
5. Market Dynamics
5.1. Market Evaluation
5.2. Drivers
5.2.1. Rising consumption due to extended shelf life
5.3. Opportunities
5.3.1. Increasing demand for the product in the food and beverage industry
6. Global Anhydrous Milk Fat Market Analysis and Forecast, By Nature
6.1. Segment Overview
6.2. Conventional
6.3. Organic
7. Global Anhydrous Milk Fat Market Analysis and Forecast, By Application
7.1. Segment Overview
7.2. Bakery
7.3. Dairy Products
7.4. Confectionery
7.5. Flavours
7.6. Others
8. Global Anhydrous Milk Fat Market Analysis and Forecast, By Distribution Channel
8.1. Segment Overview
8.2. Online Sales
8.3. Offline Sales
9. Global Anhydrous Milk Fat Market Analysis and Forecast, By Regional Analysis
9.1. Segment Overview
9.2. North America
9.2.1. U.S.
9.2.2. Canada
9.2.3. Mexico
9.3. Europe
9.3.1. Germany
9.3.2. France
9.3.3. U.K.
9.3.4. Italy
9.3.5. Spain
9.4. Asia-Pacific
9.4.1. Japan
9.4.2. China
9.4.3. India
9.5. South America
9.5.1. Brazil
9.6. Middle East and Africa
9.6.1. UAE
9.6.2. South Africa
10. Global Anhydrous Milk Fat Market-Competitive Landscape
10.1. Overview
10.2. Market Share of Key Players in the Anhydrous Milk Fat Market
10.2.1. Global Company Market Share
10.2.2. North America Company Market Share
10.2.3. Europe Company Market Share
10.2.4. APAC Company Market Share
10.3. Competitive Situations and Trends
10.3.1. Product Launches and Developments
10.3.2. Partnerships, Collaborations, and Agreements
10.3.3. Mergers & Acquisitions
10.3.4. Expansions
11. Company Profiles
11.1. FrieslandCampina
11.1.1. Business Overview
11.1.2. Company Snapshot
11.1.3. Company Market Share Analysis
11.1.4. Company Product Portfolio
11.1.5. Recent Developments
11.1.6. SWOT Analysis
11.2. Fonterra Co-operative Group Limited
11.2.1. Business Overview
11.2.2. Company Snapshot
11.2.3. Company Market Share Analysis
11.2.4. Company Product Portfolio
11.2.5. Recent Developments
11.2.6. SWOT Analysis
11.3. Flechard
11.3.1. Business Overview
11.3.2. Company Snapshot
11.3.3. Company Market Share Analysis
11.3.4. Company Product Portfolio
11.3.5. Recent Developments
11.3.6. SWOT Analysis
11.4. Groupe Lactalis
11.4.1. Business Overview
11.4.2. Company Snapshot
11.4.3. Company Market Share Analysis
11.4.4. Company Product Portfolio
11.4.5. Recent Developments
11.4.6. SWOT Analysis
11.5. Glanbia ingredients
11.5.1. Business Overview
11.5.2. Company Snapshot
11.5.3. Company Market Share Analysis
11.5.4. Company Product Portfolio
11.5.5. Recent Developments
11.5.6. SWOT Analysis
11.6. Flanders Milk
11.6.1. Business Overview
11.6.2. Company Snapshot
11.6.3. Company Market Share Analysis
11.6.4. Company Product Portfolio
11.6.5. Recent Developments
11.6.6. SWOT Analysis
11.7. Meadow Foods
11.7.1. Business Overview
11.7.2. Company Snapshot
11.7.3. Company Market Share Analysis
11.7.4. Company Product Portfolio
11.7.5. Recent Developments
11.7.6. SWOT Analysis
11.8. Arla Foods Ingredients
11.8.1. Business Overview
11.8.2. Company Snapshot
11.8.3. Company Market Share Analysis
11.8.4. Company Product Portfolio
11.8.5. Recent Developments
11.8.6. SWOT Analysis
11.9. Murray Goulburn
11.9.1. Business Overview
11.9.2. Company Snapshot
11.9.3. Company Market Share Analysis
11.9.4. Company Product Portfolio
11.9.5. Recent Developments
11.9.6. SWOT Analysis
11.10. Land O'Lakes
11.10.1. Business Overview
11.10.2. Company Snapshot
11.10.3. Company Market Share Analysis
11.10.4. Company Product Portfolio
11.10.5. Recent Developments
11.10.6. SWOT Analysis
11.11. Marsh's Dairy Products
11.11.1. Business Overview
11.11.2. Company Snapshot
11.11.3. Company Market Share Analysis
11.11.4. Company Product Portfolio
11.11.5. Recent Developments
11.11.6. SWOT Analysis
11.12. Uelzena Ingredients
11.12.1. Business Overview
11.12.2. Company Snapshot
11.12.3. Company Market Share Analysis
11.12.4. Company Product Portfolio
11.12.5. Recent Developments
11.12.6. SWOT Analysis
11.13. Royal VIN Buisman
11.13.1. Business Overview
11.13.2. Company Snapshot
11.13.3. Company Market Share Analysis
11.13.4. Company Product Portfolio
11.13.5. Recent Developments
11.13.6. SWOT Analysis
11.14. Dairy Crest Group
11.14.1. Business Overview
11.14.2. Company Snapshot
11.14.3. Company Market Share Analysis
11.14.4. Company Product Portfolio
11.14.5. Recent Developments
11.14.6. SWOT Analysis
11.15. The Tatua Co-operative Dairy Company
11.15.1. Business Overview
11.15.2. Company Snapshot
11.15.3. Company Market Share Analysis
11.15.4. Company Product Portfolio
11.15.5. Recent Developments
11.15.6. SWOT Analysis
List of Table
1. Global Anhydrous Milk Fat Market, By Nature, 2019-2032 (USD Billion)
2. Global Conventional, Anhydrous Milk Fat Market, By Region, 2019-2032 (USD Billion)
3. Global Organic, Anhydrous Milk Fat Market, By Region, 2019-2032 (USD Billion)
4. Global Anhydrous Milk Fat Market, By Application, 2019-2032 (USD Billion)
5. Global Bakery, Anhydrous Milk Fat Market, By Region, 2019-2032 (USD Billion)
6. Global Dairy Products, Anhydrous Milk Fat Market, By Region, 2019-2032 (USD Billion)
7. Global Confectionery, Anhydrous Milk Fat Market, By Region, 2019-2032 (USD Billion)
8. Global Flavours, Anhydrous Milk Fat Market, By Region, 2019-2032 (USD Billion)
9. Global Others, Anhydrous Milk Fat Market, By Region, 2019-2032 (USD Billion)
10. Global Anhydrous Milk Fat Market, By Distribution Channel, 2019-2032 (USD Billion)
11. Global Online Sales, Anhydrous Milk Fat Market, By Region, 2019-2032 (USD Billion)
12. Global Offline Sales, Anhydrous Milk Fat Market, By Region, 2019-2032 (USD Billion)
13. Global Anhydrous Milk Fat Market, By Region, 2019-2032 (USD Billion)
14. North America Anhydrous Milk Fat Market, By Nature, 2019-2032 (USD Billion)
15. North America Anhydrous Milk Fat Market, By Application, 2019-2032 (USD Billion)
16. North America Anhydrous Milk Fat Market, By Distribution Channel, 2019-2032 (USD Billion)
17. U.S. Anhydrous Milk Fat Market, By Nature, 2019-2032 (USD Billion)
18. U.S. Anhydrous Milk Fat Market, By Application, 2019-2032 (USD Billion)
19. U.S. Anhydrous Milk Fat Market, By Distribution Channel, 2019-2032 (USD Billion)
20. Canada Anhydrous Milk Fat Market, By Nature, 2019-2032 (USD Billion)
21. Canada Anhydrous Milk Fat Market, By Application, 2019-2032 (USD Billion)
22. Canada Anhydrous Milk Fat Market, By Distribution Channel, 2019-2032 (USD Billion)
23. Mexico Anhydrous Milk Fat Market, By Nature, 2019-2032 (USD Billion)
24. Mexico Anhydrous Milk Fat Market, By Application, 2019-2032 (USD Billion)
25. Mexico Anhydrous Milk Fat Market, By Distribution Channel, 2019-2032 (USD Billion)
26. Europe Anhydrous Milk Fat Market, By Nature, 2019-2032 (USD Billion)
27. Europe Anhydrous Milk Fat Market, By Application, 2019-2032 (USD Billion)
28. Europe Anhydrous Milk Fat Market, By Distribution Channel, 2019-2032 (USD Billion)
29. Germany Anhydrous Milk Fat Market, By Nature, 2019-2032 (USD Billion)
30. Germany Anhydrous Milk Fat Market, By Application, 2019-2032 (USD Billion)
31. Germany Anhydrous Milk Fat Market, By Distribution Channel, 2019-2032 (USD Billion)
32. France Anhydrous Milk Fat Market, By Nature, 2019-2032 (USD Billion)
33. France Anhydrous Milk Fat Market, By Application, 2019-2032 (USD Billion)
34. France Anhydrous Milk Fat Market, By Distribution Channel, 2019-2032 (USD Billion)
35. U.K. Anhydrous Milk Fat Market, By Nature, 2019-2032 (USD Billion)
36. U.K. Anhydrous Milk Fat Market, By Application, 2019-2032 (USD Billion)
37. U.K. Anhydrous Milk Fat Market, By Distribution Channel, 2019-2032 (USD Billion)
38. Italy Anhydrous Milk Fat Market, By Nature, 2019-2032 (USD Billion)
39. Italy Anhydrous Milk Fat Market, By Application, 2019-2032 (USD Billion)
40. Italy Anhydrous Milk Fat Market, By Distribution Channel, 2019-2032 (USD Billion)
41. Spain Anhydrous Milk Fat Market, By Nature, 2019-2032 (USD Billion)
42. Spain Anhydrous Milk Fat Market, By Application, 2019-2032 (USD Billion)
43. Spain Anhydrous Milk Fat Market, By Distribution Channel, 2019-2032 (USD Billion)
44. Asia Pacific Anhydrous Milk Fat Market, By Nature, 2019-2032 (USD Billion)
45. Asia Pacific Anhydrous Milk Fat Market, By Application, 2019-2032 (USD Billion)
46. Asia Pacific Anhydrous Milk Fat Market, By Distribution Channel, 2019-2032 (USD Billion)
47. Japan Anhydrous Milk Fat Market, By Nature, 2019-2032 (USD Billion)
48. Japan Anhydrous Milk Fat Market, By Application, 2019-2032 (USD Billion)
49. Japan Anhydrous Milk Fat Market, By Distribution Channel, 2019-2032 (USD Billion)
50. China Anhydrous Milk Fat Market, By Nature, 2019-2032 (USD Billion)
51. China Anhydrous Milk Fat Market, By Application, 2019-2032 (USD Billion)
52. China Anhydrous Milk Fat Market, By Distribution Channel, 2019-2032 (USD Billion)
53. India Anhydrous Milk Fat Market, By Nature, 2019-2032 (USD Billion)
54. India Anhydrous Milk Fat Market, By Application, 2019-2032 (USD Billion)
55. India Anhydrous Milk Fat Market, By Distribution Channel, 2019-2032 (USD Billion)
56. South America Anhydrous Milk Fat Market, By Nature, 2019-2032 (USD Billion)
57. South America Anhydrous Milk Fat Market, By Application, 2019-2032 (USD Billion)
58. South America Anhydrous Milk Fat Market, By Distribution Channel, 2019-2032 (USD Billion)
59. Brazil Anhydrous Milk Fat Market, By Nature, 2019-2032 (USD Billion)
60. Brazil Anhydrous Milk Fat Market, By Application, 2019-2032 (USD Billion)
61. Brazil Anhydrous Milk Fat Market, By Distribution Channel, 2019-2032 (USD Billion)
62. Middle East and Africa Anhydrous Milk Fat Market, By Nature, 2019-2032 (USD Billion)
63. Middle East and Africa Anhydrous Milk Fat Market, By Application, 2019-2032 (USD Billion)
64. Middle East and Africa Anhydrous Milk Fat Market, By Distribution Channel, 2019-2032 (USD Billion)
65. UAE Anhydrous Milk Fat Market, By Nature, 2019-2032 (USD Billion)
66. UAE Anhydrous Milk Fat Market, By Application, 2019-2032 (USD Billion)
67. UAE Anhydrous Milk Fat Market, By Distribution Channel, 2019-2032 (USD Billion)
68. South Africa Anhydrous Milk Fat Market, By Nature, 2019-2032 (USD Billion)
69. South Africa Anhydrous Milk Fat Market, By Application, 2019-2032 (USD Billion)
70. South Africa Anhydrous Milk Fat Market, By Distribution Channel, 2019-2032 (USD Billion)
List of Figures
1. Global Anhydrous Milk Fat Market Segmentation
2. Anhydrous Milk Fat Market: Research Methodology
3. Market Size Estimation Methodology: Bottom-Up Approach
4. Market Size Estimation Methodology: Top-Down Approach
5. Data Triangulation
6. Porter’s Five Forces Analysis
7. Value Chain Analysis
8. Global Anhydrous Milk Fat Market Attractiveness Analysis By Nature
9. Global Anhydrous Milk Fat Market Attractiveness Analysis By Application
10. Global Anhydrous Milk Fat Market Attractiveness Analysis By Distribution Channel
11. Global Anhydrous Milk Fat Market Attractiveness Analysis By Region
12. Global Anhydrous Milk Fat Market: Dynamics
13. Global Anhydrous Milk Fat Market Share by Nature (2023 & 2032)
14. Global Anhydrous Milk Fat Market Share by Application (2023 & 2032)
15. Global Anhydrous Milk Fat Market Share by Distribution Channel (2023 & 2032)
16. Global Anhydrous Milk Fat Market Share by Regions (2023 & 2032)
17. Global Anhydrous Milk Fat Market Share by Company (2022)
This study forecasts revenue at global, regional, and country levels from 2019 to 2032. The Brainy Insights has segmented the global anhydrous milk fat market based on below mentioned segments:
Global Anhydrous Milk Fat by Nature:
Global Anhydrous Milk Fat by Application:
Global Anhydrous Milk Fat by Distribution Channel:
Global Anhydrous Milk Fat by Region:
Research has its special purpose to undertake marketing efficiently. In this competitive scenario, businesses need information across all industry verticals; the information about customer wants, market demand, competition, industry trends, distribution channels etc. This information needs to be updated regularly because businesses operate in a dynamic environment. Our organization, The Brainy Insights incorporates scientific and systematic research procedures in order to get proper market insights and industry analysis for overall business success. The analysis consists of studying the market from a miniscule level wherein we implement statistical tools which helps us in examining the data with accuracy and precision.
Our research reports feature both; quantitative and qualitative aspects for any market. Qualitative information for any market research process are fundamental because they reveal the customer needs and wants, usage and consumption for any product/service related to a specific industry. This in turn aids the marketers/investors in knowing certain perceptions of the customers. Qualitative research can enlighten about the different product concepts and designs along with unique service offering that in turn, helps define marketing problems and generate opportunities. On the other hand, quantitative research engages with the data collection process through interviews, e-mail interactions, surveys and pilot studies. Quantitative aspects for the market research are useful to validate the hypotheses generated during qualitative research method, explore empirical patterns in the data with the help of statistical tools, and finally make the market estimations.
The Brainy Insights offers comprehensive research and analysis, based on a wide assortment of factual insights gained through interviews with CXOs and global experts and secondary data from reliable sources. Our analysts and industry specialist assume vital roles in building up statistical tools and analysis models, which are used to analyse the data and arrive at accurate insights with exceedingly informative research discoveries. The data provided by our organization have proven precious to a diverse range of companies, facilitating them to address issues such as determining which products/services are the most appealing, whether or not customers use the product in the manner anticipated, the purchasing intentions of the market and many others.
Our research methodology encompasses an idyllic combination of primary and secondary initiatives. Key phases involved in this process are listed below:

The phase involves the gathering and collecting of market data and its related information with the help of different sources & research procedures.

The data procurement stage involves in data gathering and collecting through various data sources.
This stage involves in extensive research. These data sources includes:
Purchased Database: Purchased databases play a crucial role in estimating the market sizes irrespective of the domain. Our purchased database includes:
Primary Research: The Brainy Insights interacts with leading companies and experts of the concerned domain to develop the analyst team’s market understanding and expertise. It improves and substantiates every single data presented in the market reports. Primary research mainly involves in telephonic interviews, E-mail interactions and face-to-face interviews with the raw material providers, manufacturers/producers, distributors, & independent consultants. The interviews that we conduct provides valuable data on market size and industry growth trends prevailing in the market. Our organization also conducts surveys with the various industry experts in order to gain overall insights of the industry/market. For instance, in healthcare industry we conduct surveys with the pharmacists, doctors, surgeons and nurses in order to gain insights and key information of a medical product/device/equipment which the customers are going to usage. Surveys are conducted in the form of questionnaire designed by our own analyst team. Surveys plays an important role in primary research because surveys helps us to identify the key target audiences of the market. Additionally, surveys helps to identify the key target audience engaged with the market. Our survey team conducts the survey by targeting the key audience, thus gaining insights from them. Based on the perspectives of the customers, this information is utilized to formulate market strategies. Moreover, market surveys helps us to understand the current competitive situation of the industry. To be precise, our survey process typically involve with the 360 analysis of the market. This analytical process begins by identifying the prospective customers for a product or service related to the market/industry to obtain data on how a product/service could fit into customers’ lives.

Secondary Research: The secondary data sources includes information published by the on-profit organizations such as World bank, WHO, company fillings, investor presentations, annual reports, national government documents, statistical databases, blogs, articles, white papers and others. From the annual report, we analyse a company’s revenue to understand the key segment and market share of that organization in a particular region. We analyse the company websites and adopt the product mapping technique which is important for deriving the segment revenue. In the product mapping method, we select and categorize the products offered by the companies catering to domain specific market, deduce the product revenue for each of the companies so as to get overall estimation of the market size. We also source data and analyses trends based on information received from supply side and demand side intermediaries in the value chain. The supply side denotes the data gathered from supplier, distributor, wholesaler and the demand side illustrates the data gathered from the end customers for respective market domain.

The supply side for a domain specific market is analysed by:
The demand side for the market is estimated through:
In-house Library: Apart from these third-party sources, we have our in-house library of qualitative and quantitative information. Our in-house database includes market data for various industry and domains. These data are updated on regular basis as per the changing market scenario. Our library includes, historic databases, internal audit reports and archives.
Sometimes there are instances where there is no metadata or raw data available for any domain specific market. For those cases, we use our expertise to forecast and estimate the market size in order to generate comprehensive data sets. Our analyst team adopt a robust research technique in order to produce the estimates:
Data Synthesis: This stage involves the analysis & mapping of all the information obtained from the previous step. It also involves in scrutinizing the data for any discrepancy observed while data gathering related to the market. The data is collected with consideration to the heterogeneity of sources. Robust scientific techniques are in place for synthesizing disparate data sets and provide the essential contextual information that can orient market strategies. The Brainy Insights has extensive experience in data synthesis where the data passes through various stages:


Market Deduction & Formulation: The final stage comprises of assigning data points at appropriate market spaces so as to deduce feasible conclusions. Analyst perspective & subject matter expert based holistic form of market sizing coupled with industry analysis also plays a crucial role in this stage.
This stage involves in finalization of the market size and numbers that we have collected from data integration step. With data interpolation, it is made sure that there is no gap in the market data. Successful trend analysis is done by our analysts using extrapolation techniques, which provide the best possible forecasts for the market.
Data Validation & Market Feedback: Validation is the most important step in the process. Validation & re-validation via an intricately designed process helps us finalize data-points to be used for final calculations.

The Brainy Insights interacts with leading companies and experts of the concerned domain to develop the analyst team’s market understanding and expertise. It improves and substantiates every single data presented in the market reports. The data validation interview and discussion panels are typically composed of the most experienced industry members. The participants include, however, are not limited to:
Moreover, we always validate our data and findings through primary respondents from all the major regions we are working on.
Free Customization
Fortune 500 Clients
Free Yearly Update On Purchase Of Multi/Corporate License
Companies Served Till Date